
Nick Cobb


Recently I ran across a post about setting up Splunk to work with DeployStudio via Noel Balonso. I began using Splunk for reporting on my Apple and Windows (test) imaging environments, to much satisfaction.
In the meantime, I have also been working with McAfee’s EEMac product for full-disk encryption in OS X. Our org has been comparing its performance to FileVault 2 and trying to make a decision as to whether or not to proceed based on our existing environment for Windows management, which also utilizes McAfee’s FDE product for Windows (formerly Safeboot). We decided to use the information we could pull from Splunk to compare disk I/O of McAfee vs. FileVault. The script borrowed from the Splunk App for *nix (iostat) reports the disk i/o in Operations per second (for both read and write), as well as Kilobytes per second (for both read and write). While this is not a all-encompassing measure of machine performance before, during, and after encryption phases, it does point us in the direction of knowing which product may keep the disk busiest during the phases, as well as (when compared to other machine reporting) allow for a better overall picture of the encryption impact on the machine.
Step 1 – Image each of the MBAs with the OEM factory Apple image, so that machine configuration would be at complete defaults to establish a valid base for this test.
Step 2 – Setup the machines with generic local admin account.
Step 3 – Download Splunk universal forwarder to each machine. You will also need to have the Splunk App for *nix installed on your receiving server in order to pull the pre-written scripts to each client for testing.
After both machines received the appropriate files, it was time to commence setup for baseline testing.
Step 4 – Run the installer package for universal forwarder. Nothing out of the ordinary here, just run through the package to install. When finished, move to the next step.
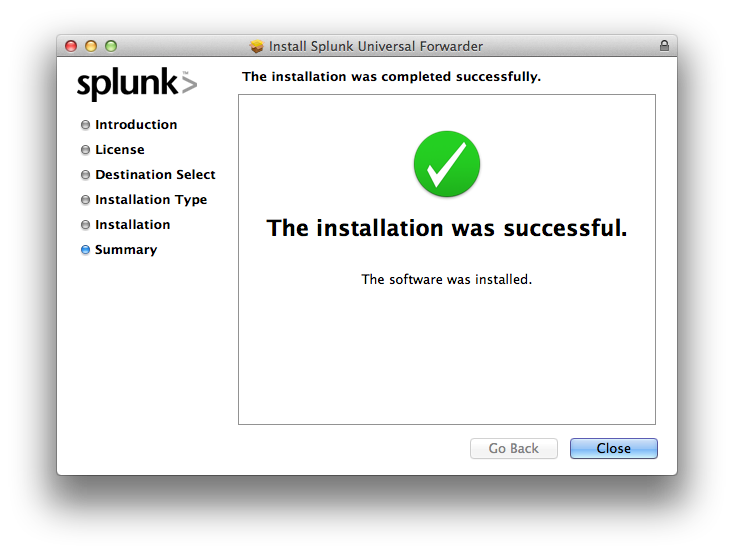
Step 5 – Once the package completes, close the ReadMe in TextEdit (read it first), and close any other items that are open. Copy scripts borrowed from Splunk app for *nix to /Applications/SplunkForwarder/bin/scripts/iostat/ on each MBA that will be tested.
(It is worth noting that normally, the typical place to insert scripts is in the /scripts/ folder from the path above. However, because I wanted the sources to reflect differently than other production reporting I am doing, I chose to create the
iostatdirectory and copied all of the scripts into that folder for uniqueness.)(It is also worth mentioning that I initially copied just the
iostat.shscript from the Splunk App for *nix to this directory, only to find that my forwarders were showing in Deployment Monitor, but not adding any search data. This was due to the fact that the script was running, but sending an error to the server that other scripts it relied upon (common.sh) were not found. For this reason, I copied over all of the scripts just in case.)
Step 6 – Open a Terminal window, and navigate to the installation directory, in my case /Applications/SplunkForwarder/bin/.
Step 7 – Start the Splunk universal forwarder by typing the command (you may have to authenticate as root to perform these commands):
./splunk start --accept-license
Step 8 – Enable boot-start configuration so the forwarder starts at startup:
./splunk enable boot-start
Step 9 – Set the forwarder to send data to the receiving server (substitute <ipaddress:port> with your server’s address and receiving port):
./splunk add forward-server <ipaddress:port>
Step 10 – Set the forwarder to execute the script (sourcetype and interval (seconds) can be set to your choosing, however these were my settings):
sudo ./splunk add exec /Application/SplunkForwarder/bin/scripts/iostat/iostat.sh -sourcetype 'Apple Disk I/O' -interval 60.0
Step 11 – At this point, your server should be showing your machine as a host. Repeat this process for the second test machine.
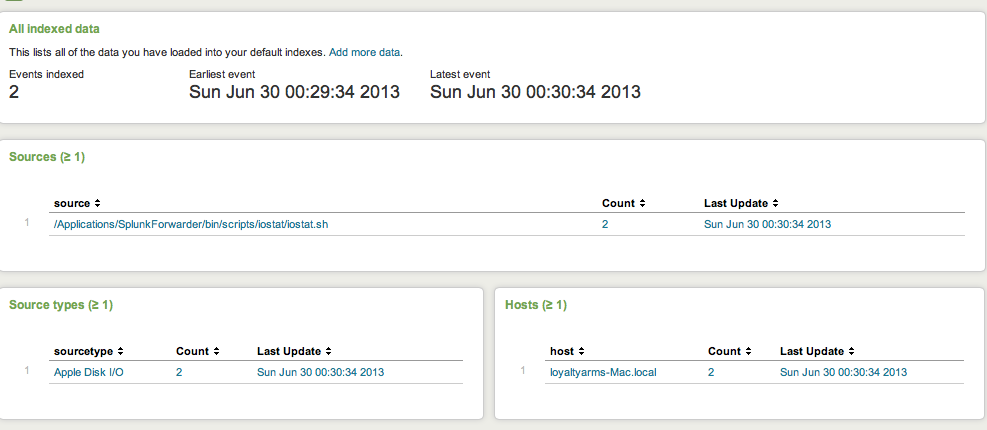
If these steps didn’t work for you, there are a few things look at to troubleshoot your deployment. First, you can install the Splunk Deployment Monitor App, which will allow you to view forwarders even if they are not reporting. Second, you can follow these instructions to search the internal indexes to see if there are problems with your forwarders. Feel free to post comments if you need help, and I will assist!
So now that we have the data being sent to our Splunk server, what can we do with it? The Splunk App for *nix provided us with the iostat.sh script to check on disk i/o and try to report on what is going on. Inside that script, you will notice that for machines using Darwin kernel (splunk calls it a platform), there are several categories that will get reported as headers in the table for our source. The way splunk reads it as reported by the script, those headers are:
rReq_PS (Shown in the script as: Operations Read (per second)wReq_PS (Shown in the script as: Operations Write (per second)rKB_PS (Shown in the script as: KiloBytes Read (per second)wKB_PS (Shown in the script as: KiloBytes Write (per second)Other headers include the device, and time and bandwidth measures. I could never get the latter 2 to show me any data, perhaps a problem with the script? For my reporting, I setup a search that extracted fields from the headers of the table, and reported on those fields in a simplified table based on Operations (both read/write) and KiloBytes (both read/write), then displayed those as a charted visualization based on the average value per minute (remember my interval is 60.0 seconds). I extended the search for a custom time frame, in this case 8 hours, the length of a typical work day and sure to cover all periods previous for quick glance reporting on my dashboard visualizations. For the purposes of this posting, I will note where that time visualization was customized in [Parts 2]() and [3]() when I post the results.
Stay tuned for [Part 2]()! I will be posting the search mechanisms for the Disk I/O, and will show how to create a visualization based on the data for each search. If you want to become more familiar with Splunk in the meantime, you can check out my Splunk search repository on Github.